2019-2020 Annual Report
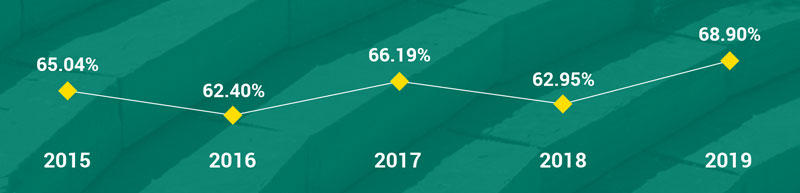
New Student Fall to Spring Persistence
Degrees & Certificates Awarded
2014-2015: 857
2015-2016: 810
2016-2017: 729
2017-2018: 811
2018-2019: 787
2019-2020: 741
81% Course Success Rate
15 : 1 Student-to-Faculty ratio
Annualized Enrollment
5,970 Unduplicated Credit
1,811 Unduplicated Non-Credit
2,664 Transfer
714 CTE
2,667 Non-Degree Seeking
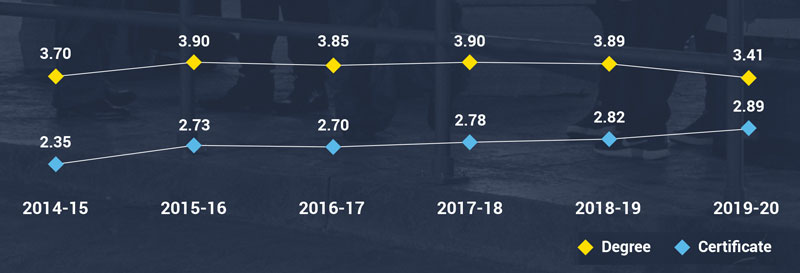
Average Time to Completion (Years)
From Where?
Laramie County: 3,759
Albany County: 952
Other Wyoming Counties: 563
Out-of-state: 663
International: 29
Student Age
Under 18: 1,892
18-24: 2,435
25+: 1,642
High School
Concurrent: 1,431
Dual/Jump: 532
Unduplicated: 1,794
Pathway Headcounts
Not all students are in a Pathway; a student can be in multiple Pathways.
New Student Pathway Headcounts |
2015 |
2016 |
2017 |
2018 |
2019 |
| Agriculture & Equine | 67 | 53 | 55 | 60 | 68 |
| Business & Accounting | 84 | 86 | 87 | 91 | 132 |
| Communication & Creative Arts | 145 | 60 | 63 | 72 | 54 |
| Human & Public Services | 132 | 184 | 182 | 192 | 217 |
| Health Sciences & Wellness | 223 | 217 | 262 | 250 | 291 |
| Science, Technology, Engineering & Math | 95 | 102 | 77 | 124 | 140 |
| Trades & Technical Studies | 61 | 102 | 94 | 108 | 133 |
| Totals | 1,127 | 1,181 | 982 | 1,023 | 1,056 |
Pathway Percent of Total New Students |
2015 |
2016 |
2017 |
2018 |
2019 |
| Agriculture & Equine | 6% | 4% | 6% | 6% | 6% |
| Business & Accounting | 7% | 7% | 9% | 9% | 12% |
| Communication & Creative Arts | 13% | 5% | 6% | 7% | 5% |
| Human & Public Services | 12% | 16% | 19% | 19% | 21% |
| Health Sciences & Wellness | 20% | 18% | 27% | 24% | 28% |
| Science, Technology, Engineering & Math | 8% | 9% | 8% | 12% | 13% |
| Trades & Technical Studies | 5% | 9% | 10% | 11% | 13% |
Financial Breakdown
Expenditures by Series
$45,159,953
Expenditures by Program
$43,640,285
Revenues
$43,642,171