2022-2023 Annual Report
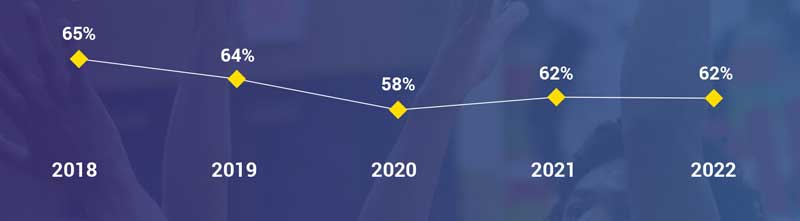
New Student Fall to Spring Persistence
Degrees & Certificates Awarded
2017-2018: 814
2018-2019: 789
2019-2020: 747
2020-2021: 728
2021-2022: 770
2022-2023: 783
14 : 1 Student-to-Faculty ratio
82% Course Success Rate
Outreach & Workforce Development
2,924 Workforce Training Registrations
1,940 Life Enrichment Registrations
574 Adult Education Registrations
5,438 Total Non-Credit Registrations
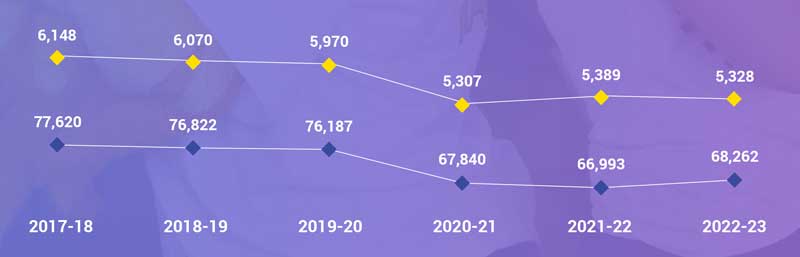
Annualized Enrollment
5,328 Unduplicated Credit
68,262 Student Credit Hours
2,514 Transfer
1,127 Career & Technical Education
2,348 Non-Degree Seeking
Annual Enrollment Trends
From Where?
Laramie County: 3,098
Albany County: 853
Other Wyoming Counties: 584
Out-of-state: 764
International: 29
Student Age
Under 18: 1,674
18-24: 2,410
25+: 1,244
High School
Concurrent: 1,232
Dual/Jump: 545
Unduplicated: 1,527
Pathway Headcounts
Not all students are in a Pathway; a student can be in multiple Pathways.
Student Pathway Headcounts |
2018 |
2019 |
2020 |
2021 |
2022 |
| Agriculture & Equine | 138 | 148 | 142 | 111 | 149 |
| Business & Accounting | 429 | 467 | 449 | 466 | 438 |
| Communication & Creative Arts | 284 | 234 | 175 | 175 | 184 |
| Human & Public Services | 831 | 792 | 725 | 610 | 600 |
| Health Sciences & Wellness | 1,384 | 1,363 | 1,354 | 1,285 | 1,267 |
| Information Technology | 150 | 169 | 128 | 144 | 141 |
| Science, Technology, Engineering & Math | 357 | 368 | 353 | 340 | 335 |
| Trades & Technical Studies | 249 | 249 | 196 | 224 | 175 |
| Totals | 3,391 | 3,342 | 3,158 | 3,075 | 2,980 |
Pathway Percent of Total Students |
2018 |
2019 |
2020 |
2021 |
2022 |
| Agriculture & Equine | 6% | 6% | 7% | 4% | 5% |
| Business & Accounting | 9% | 12% | 13% | 13% | 15% |
| Communication & Creative Arts | 7% | 5% | 6% | 5% | 6% |
| Human & Public Services | 19% | 21% | 19% | 19% | 20% |
| Health Sciences & Wellness | 24% | 28% | 32% | 38% | 43% |
| Information Technology | 3% | 2% | 1% | 4% | 5% |
| Science, Technology, Engineering & Math | 12% | 13% | 14% | 10% | 11% |
| Trades & Technical Studies | 9% | 10% | 8% | 7% | 6% |
Financial Breakdown
Expenditures by Series
$47,241,776
Expenditures by Program
$47,241,776
Revenues
$48,619,734